In one of my last post – Prioritizing a Threat Detection Backlog, I talked about prioritizing your threat detection backlog. It is true when you run a program in an organization. However, when you consume security content from another organization, severity is often generalized. This is where, the concept of expected severity can help and I trust should be used more often. Let me explain.
Security teams operate under a constant barrage of alerts. Detection processes, security platforms, and endpoint tools generate thousands of these alerts. Organizations that prioritize alerts solely on severity essentially, treat all such alerts equally on one critical dimension while ignoring the most important one: the probability that an alert actually represents a real threat. This is my attempt at exploring why severity alone is insufficient and introduce a a mathematically concept of “Expected Severity” to combine probability and impact to surface genuinely actionable alerts.
What is Expected Severity?
In mathematics, an expected value uses probability to tell us what outcome to expect in the long run. We can adopt this context in security in the following manner:
Expected severity is the average outcome if a particular security event were to be repeated many times in all possible combinations, what would it’s severity be.
It helps you answer a fundamental question: What is the average outcome if I make this decision repeatedly? To calculate it, you multiply the probability of an outcome by the magnitude of that outcome. For example, you have an alert for SQL injection vulnerability in a customer-facing application:
- Severity if exploited: Data breach affecting 50,000 customers = $2.5 million impact (fines, remediation, reputation).
- Probability of exploitation in next 30 days: 15% (0.15) based on threat intelligence showing active scanning for this vulnerability type.
- Cost to remediate immediately: $20,000 (developer time, testing, deployment).
Hence,
Expected Loss Without Remediation = $2,500,000 × 0.15 = $375,000
The expected loss ($375,000) vastly exceeds the remediation cost ($20,000), making immediate patching the clear decision! Now comparing this with a different vulnerability:
- Severity if exploited: Denial of service on internal dev tool = $5,000 impact
- Probability of exploitation: 2% (0.02) – requires insider access
- Cost to remediate: $8,000
Expected Loss = $5,000 × 0.02 = $100
Here the expected loss ($100) is far less than the remediation cost ($8,000), suggesting that this can be deprioritized relative to the first vulnerability.
The same principle applies directly to alert prioritization in security operations.
Expected Severity: The Foundation
Expected value, another mathematical concept helps us answer a fundamental question – what is the average outcome if I make this decision repeatedly? We combine this with expected severity combines alert severity with the probability that the alert is a true positive (TP). Having established this, we can safely say:
Here:
- Alert Severity is the impact if the alert represents a genuine threat (scored numerically, e.g., 1–10 or 1–100)
- Probability of True Positive is the estimated likelihood that this particular alert instance is real (expressed as a decimal between 0 and 1)
Something like this has been used in quantitative risk analysis. Organizations calculate Annual Loss Expectancy (ALE) using the same multiplicative principle: ALE = Single Loss Expectancy × Annual Rate of Occurrence. Likewise, in project management, Expected Monetary Value (EMV) uses identical logic for prioritizing risks and opportunities.
Example 1: High Severity, Low Probability
Imagine an alert for “Unusual process execution from system kernel.” The organization rates this as severity 9 because if it’s real, it indicates malware infection or privilege escalation. However, tuning analysis shows this rule has only a 2 percent true positive rate—it fires constantly on benign system updates, scheduled maintenance tasks, and vendor-supplied tools.
Expected Severity = 9 × 0.02 = 0.18
Example 2: Medium Severity, High Probability
Now consider an alert for “Multiple failed authentication attempts followed by success.” The organization rates this as severity 6 because if real, it indicates a successful brute-force attack. However, historical incident correlation shows this pattern has a 65 percent true positive rate—it’s well-tuned, statistically strong, and correlates reliably with actual compromise attempts.
Expected Severity = 6 × 0.65 = 3.9
In this case, the second alert, despite lower severity, has a much higher expected severity (3.9 vs. 0.18) and deserves priority for analyst investigation.
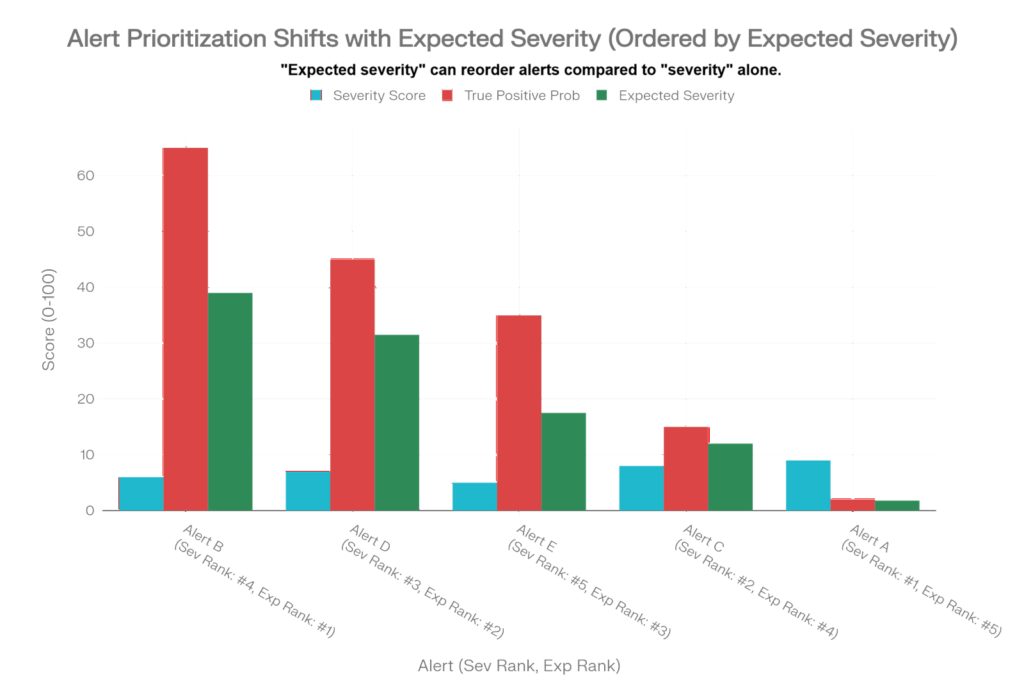
The chart above illustrates how this principle reorders prioritization across a diverse set of alerts. Alert A (unusual kernel process) has the highest raw severity but ranks last by expected severity due to its low probability of being real. Alert B (multiple failed logins), conversely, ranks first by expected severity despite medium severity, because its high probability of being real substantially increases its value.
Expected Severity: Advantages
Prioritizing by expected severity rather than severity alone will deliver measurable improvements across multiple dimensions:
- Reduced alert fatigue: If an analyst investigates 100 high-severity alerts each with a 1 percent true positive rate, they investigate approximately 99 false positives and 1 real incident. If they instead prioritize 100 alerts by expected severity, weighted by probability, they concentrate their effort where it’s most likely to matter. Over time, this compounds: each hour saved on false positives is an hour available for threat hunting, tuning, and strategic security work.
- Improved detection quality: Alert fatigue doesn’t just waste time; it degrades investigation quality. By surfacing the alerts most likely to be real, organizations will reduce cognitive load and allow analysts to conduct more careful, rigorous investigations.
- Faster incident response: When alerts are ranked by expected severity, genuine threats surface immediately rather than being buried below dozens of false positives. Studies show that this prioritization approach, applied through machine learning frameworks, can reduce the time to respond to actionable incidents by 23 percent or more.
- Better resource allocation: Security teams are always strapped for capacity. Expected severity directs that capacity toward the alerts with the highest combined impact and likelihood, maximizing return on analyst attention—a precious and expensive resource.
Implementation Considerations:
Calculating expected severity requires one additional input beyond traditional severity scoring: the probability of true positive for each alert or rule. Organizations can estimate and refine this probability through the implementation of:
- Historical analysis
- Rule tuning and feedback loop
- Threat intelligence integration
- Machine learning with additional statistical models
- Context enrichment